graphicalscripteditor
Graphical Script Editor
The Graphical Script Editor (GSE) was introduced in release 6.0. It aims at fast and comfortable design of simple test scripts in a graphical form.
The GSE is just an alternative view of the script code. There's always a TPR script behind it and you are free to customize it in the script editor as needed. Java test scripts are currently not supported by the GSE.
The script editor appearance can be configured in the Edit->Preferences→Editor Appearance window. You may choose to use the graphical editor, the code one or both.
Script Design
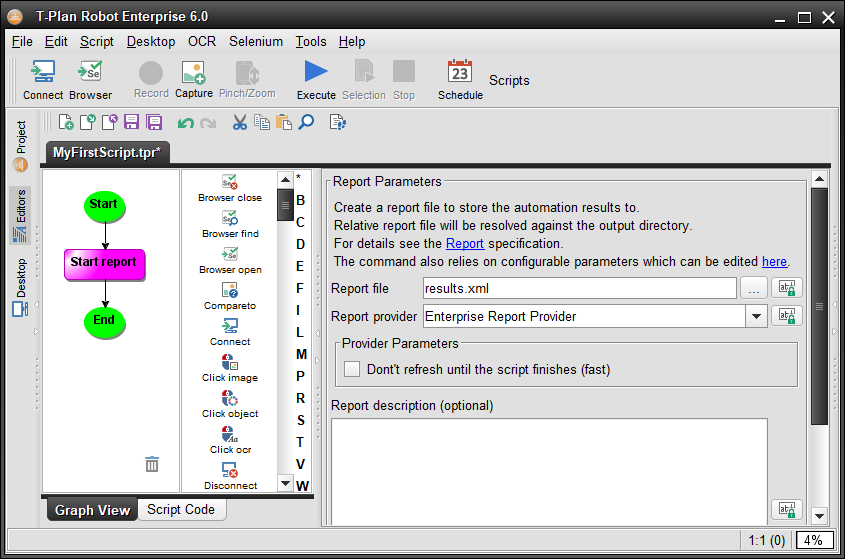
When you create a new script while the GSE is enabled you get a view like this:
There's one default element called "Start report" in the graph. The view on the right displays its properties.
To add an element (command):
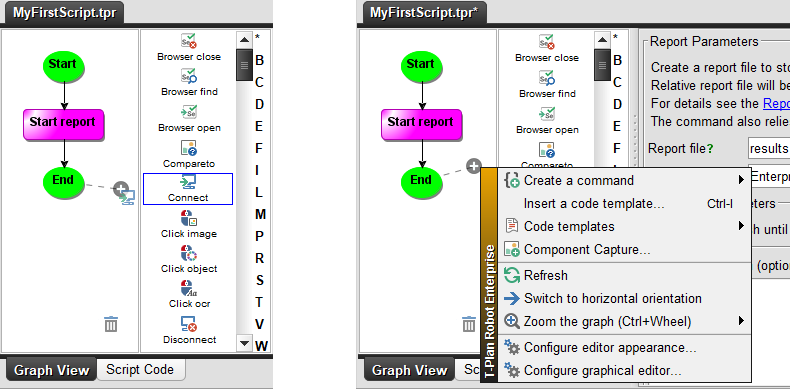
- Drag an item from the middle list and drop it next to an existing element. The new command will be inserted after it.
- Alternatively right click next to an existing element and choose "Create a command" in the context menu.
To view or edit an element:
- Left click it and edit the properties in the right hand view
- Alternatively double click the element or right click and select "Properties" to open the command property editor in a new window.
To delete an element do one of:
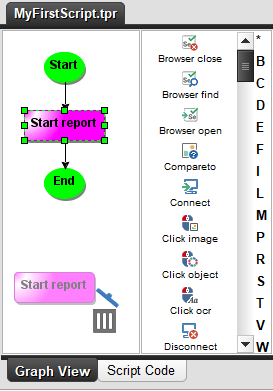
- Drag it to the garbage bin icon in the bottom right corner.
- Press Delete on the keyboard.
- Right click the element and select "Delete" from the context menu.
Error Handling
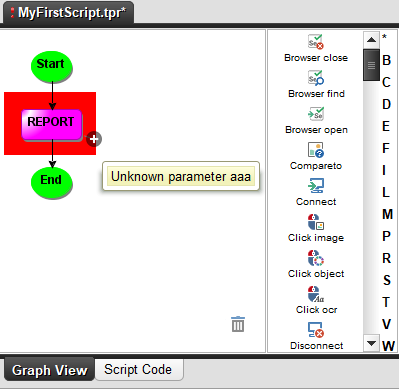
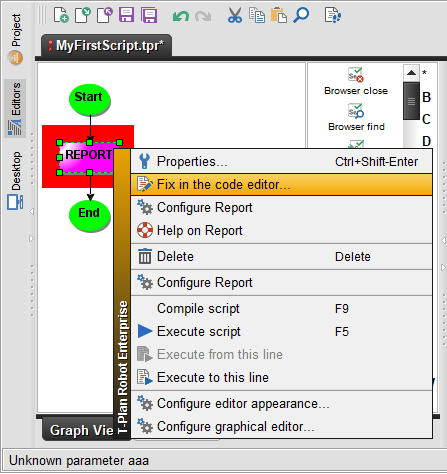
When the command is not correct due to invalid parameters or another syntax error it gets highlighted in red. The red exclamation mark before the script file name indicates that the script contains one or more errors. To view the error hover the mouse pointer near or above the element. Alternatively click the element to display the error text in the bottom tool bar. The details are also listed in the Compiler tab of the Tool Panel component.
Most errors can be resolved by an update of the command properties. Experienced users may switch to the code editor and resolve it manually. Go to the corresponding location in the code right click the component and select the "Fix in the code editor" item.
Appearance
To modify the graph appearance go to the Edit→Preferences→Graphical Editor screen. You may choose your preferred colors and effects.
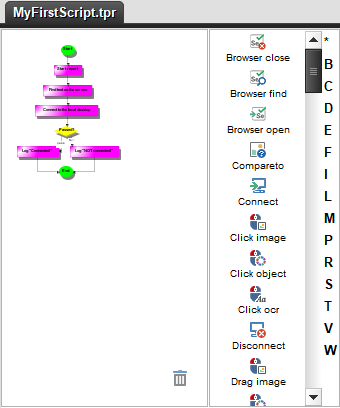
To zoom the graph scroll your mouse wheel up (Zoom In) or down (Zoom Out) while pressing the Ctrl key on the keyboard. An example of the zoomed view is on the following picture.

