Introducing the Robot UI
The T-Plan Robot Enterprise Graphical User Interface (GUI) is based on Java Swing and is platform independent. This allows the look and feel of the application to remain constant across various operating systems therefore increasing familiarity and reducing the learning curve.
The UI consists of the main application window and a set of child windows (dialogs).
The connection window
The window consists of the following elements:
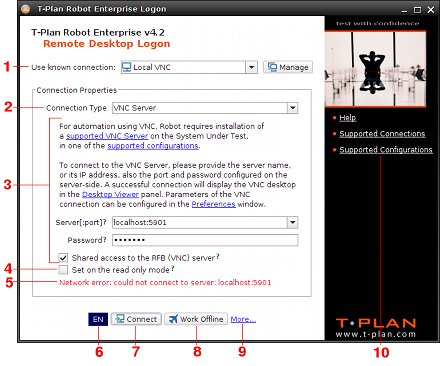
- The Use Known Connection drop down is supported since v4.2. It allows to populate the parameters from a known connection stored in the Connection Manager tool.
The connection window, or often termed 'login window' is the first screen that is presented to the user upon launching the application. It is also accessible from within the main UI by selecting the "Connect" button from the quick access toolbar (ribbon).
This window allows you establish the connection between the Robot UI and the system to be automated.
There are a number of options/fields here which together cover all of the available supported configurations, as discussed in the previous chapter – "Setting up the Environments".
The "Connection Type" drop list contains the following options:
- Local Desktop – Automation of applications and system components displayed on the local desktop i.e. the same single machine that is running T-Plan Robot.
- VNC Server – Automation over the RFB (VNC) 3.3, 3.7 or 3.8 protocol.
- RDP Server – Automation of a target environment over the RDP protocol.
- Android Over ADB – Automation of Android devices connected through the USB cable over the Android Debug Bridge (ADB) tool.
- iOS over Xcode – Automation of iOS devices connected through USB to a Mac.
- iOS Mirror – Automation of iOS devices using a combination of QuickTime/AirPlay screen mirroring and the T-Plan or VNC server.
- Static Image – Automation of image files or systems with image file output.
The "Work Offline" button allows you to launch the Robot UI without establishing any connection to a target environment.
Project Tool Panel
The Tool Panel is the tabbed view situated at the top left corner of the T-Plan Robot Enterprise window. It consists of five tabs:
- The
 Project tab displays details of the current project, including all project assets and reports.
 - The
 Paths tab configures I/O settings of the currently active script. The tab is not visible when no script is opened.
 - The
 Variables tab displays the table of compilation and execution variables of the currently active script. The tab is not visible when no script is opened.
 - The
 Compiler tab provides a list of errors produced by the last compilation of all open scripts. The tab is not visible when no script is opened.
 - The
 Exec Log tab is a cumulative view of script execution logs. This component is described in its own Execution Log help topic. The tab is not visible if no script is opened and there are no execution logs (no script has been executed since the application start).
The following sections explain each tab in more detail.
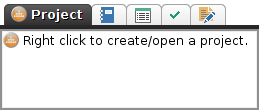
Project Tab
This displays resources of the current project and is organized as a tree. New project assets can be created and existing ones modified either through the application main menu or via a context sensitive Right Mouse Click (RMC).
When a project is opened its assets are presented an accessible in a tree structure, under four main sections:
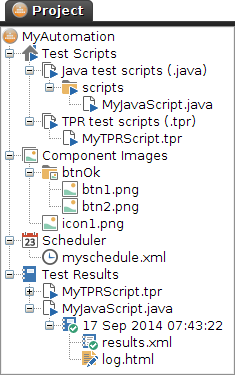
- The root node displays the project name (the project folder name). To get the menu of project specific actions right click here.
- The Scripts branch provides a view of all scripts, of both Java and TPR format. Double clicking a script node will open it in the Script Editor. Supports drag/drop of scripts for easy organization.
- The Component Images branch shows available template images and image collections across the entire project. Supports drag/drop of image templates/collections for easy reorganization and maintenance.Templates can be edited or newly created via the RMC.
- The Scheduler branch manages schedules.
- The Results node provides a summary of reports and logs produced by executed scripts.The Results structure consists of both the results (XML) and the execution log (html) for each execution.If the report is in the XML format the report file as well as its folder icons reflect the report status and/or result as follows:
Report Icon | Folder Icon | Status |
|---|---|---|
|
| Execution in progress. |
|
| Successfully completed. |
|
| Failed (the script was either stopped or produced an exit code > 0). |
|
| Invalid report (unknown or corrupted format) |
|
| No XML report available (the folder contains just the execution log and/or a report in the HTML format). |
Paths Tab
This tab works closely with the script in the active editor. Its controls correspond to commands in the script and any change will be reflected in the script content. The same goes vice-versa should the script itself employ the "_REPORT_DIR" and "_TEMPLATE_DIR" commands in order to force the paths accordingly.
Should the script content not define these variables the default settings will be used, as set within this "Paths" section.
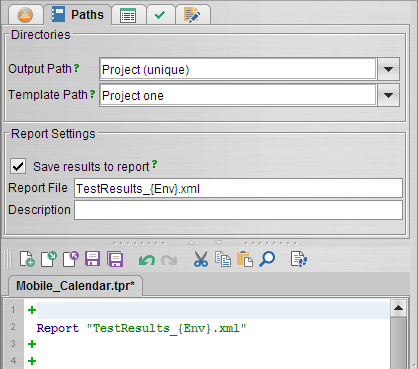
The Output Path is a directory where screenshots, reports and other output files resulting from the script execution will be saved. A change of the path will update the "_REPORT_DIR" variable in the current script. The drop down offers the following options:
- Project (unique) – All script output is redirected to a unique sub directory based on "<script>_<timestamp>".
- Project (shared) – Script output is saved to the default project folder. Outputs will be rewritten on each execution.
- Global – Redirect the script outputs a global path specified in the Language panel of the Preferences window.
- Custom – Save the script outputs to a custom path of your choosing.
The Template Path is the directory that will be searched for [relatively] referenced template images and image collections. A change of the path will update the “_TEMPLATE_DIR” variable in the current script. The drop down offers the following options:
- Project template dir – Resolve relatively referenced template images against the project template path at <project_home>/templates.
- Global – Resolve relatively referenced template images against a global path specified in the Language panel of the Preferences window.
- Custom – Search for template images in any given custom path.
Save results to report – inserts a Report command into the active editor when selected. When the command gets executed it saves the automation results such as script(s), steps, warnings, screen shots and logs to an HTML or XML report file in the specified Output Path.
Report File – defines the report file name. It must have either the ".html" or ".xml" extension. It is highly recommended to use the XML format which more efficient, customizable and it allows to export the results to T-Plan Professional or any other 3rd party tool through an XSL transformation. The XML file can be also viewed in any web browser the same way as an HTML one. For an example see the sample XML report at our web site.
Description – is an optional description to be displayed in the report header.
Variables Tab
There are generally three types of variables:
- Predefined variables, sometimes also called implicit ones. Their name typically starts with underscore '_'. These are created by the underlying automation framework for each script compilation or execution.
- Custom variables defined in the script through the Var and Eval commands (TPR scripts) or the getContext().setVariable() method calls (Java scripts).
- Variables automatically created by executed commands or method calls.
The Variables tab contains two independent variable tables:
- The Compilation Variables ("Compilation Vars") tab displays the list of variables defined during the most recent script compilation.
- The Execution Variables ("Exec Vars") tab displays the list of variables defined during the most recent script execution. The table will contain a similar variable set as the compilation one plus any variables produced by the executed commands, such as for example by the image comparison or the File/Excel I/O.
The following image displays an example of the execution variable table of a simple Java script with a variable called MY_VARIABLE. A right click onto the variable row opens up a context menu with the following actions:
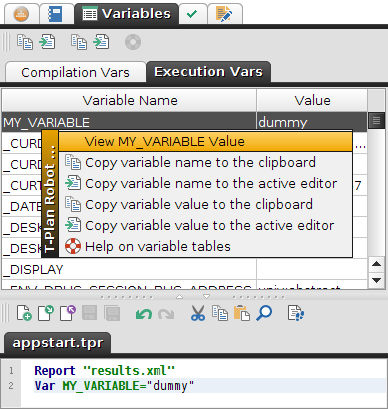
- The "View MY_VARIABLE value" displays a simple window with its value. This allows to view long and/or multiline values. Viewing of the variable value is also possible through a double click onto the variable.
- The
 "Copy variable name to the clipboard" menu item will copy the variable name enclosed in curly braces to the system clipboard from where it can be pasted to any other application.
 - The
 "Copy variable name to the active editor" item will copy the variable name enclosed in curly braces to the active editor at the current cursor location. This is in fact a variable call and it will be replaced with the actual variable value when the script gets executed.
 - The "Copy variable value to the clipboard" item will copy the variable value to the system clipboard.
- The "Copy variable value to the active editor" item will copy the variable value to the active editor at the current cursor location.
Compiler Tab
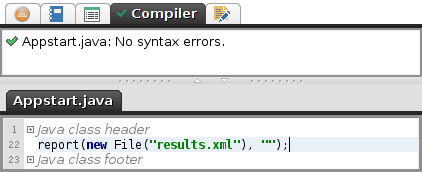
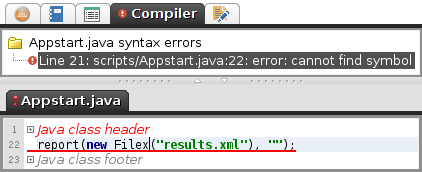
The Compiler tab displays error and warning messages from the most recent compilation of the current script.
When there are no errors the Compiler tab has the ![]() icon and the component reports "No syntax errors".
icon and the component reports "No syntax errors".
When there are errors the Compiler tab displays the ![]() icon, the script editor tab has the
icon, the script editor tab has the ![]() icon and the component displays the errors in form of a simple tree. Clicking on an error message will make the script editor jump to the corresponding code line.
icon and the component displays the errors in form of a simple tree. Clicking on an error message will make the script editor jump to the corresponding code line.
Execution Log Tab
The Execution Log viewer is a GUI component which displays a cumulative logs from all scripts that have been executed in the current session. It is intended to track details of a script execution and to simplify debugging of script failures.
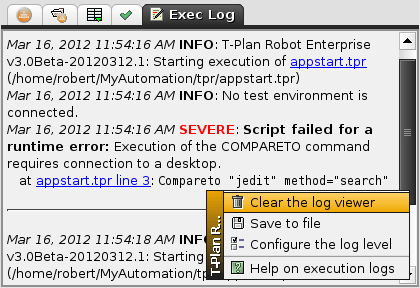
A right click into the log pane opens up a menu with the following items:
- The "Clear the log viewer" item clears all logs from the viewer. As the viewer holds just a copy of the logs this operation will not have any effect on the resulting log files.
- The "Save to file" item saves the viewer content or the selected logs to an HTML file.
- The "Configure the log viewer" item leads to the Log Command section of the Preferences window which allows to configure the minimum logging level and other settings.
- The "Help on execution logs" item opens the online help documentation.
Script Editor
The script editor allows to create and edit scripts. It is a standard text editor with additional features designed to facilitate easy writing, execution and debugging of scripts. Editors are organized in tabbed panes for each open script. Each editor consists of three main components:
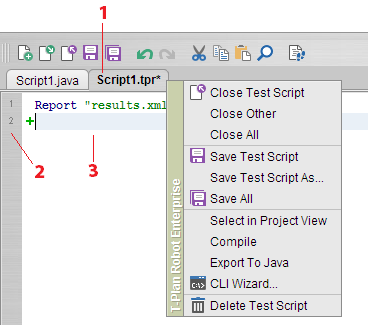
- The Enclosing tabbed pane serves as the editor container. The tab name is always set to the script file name. If the editor content has been modified, an asterisk gets appended to the name. When you hover your mouse pointer over the tab text, it displays a tool tip message with the full script file path. The tab also provides a context menu on a right mouse click with a selection of actions available in the main GUI File menu, such as "Close Script" or "Save Script".
- The Editor gutter provides line numbering and allows to define break points to suspend (pause) the script execution at.
- The Code Editor is a standard text editor featuring:
- The code syntax highlighting improves readability of the code and helps to distinguish individual elements of the script language.
- The Editor Context Menu provides access to selected actions of the script and/or the particular script element at the current line.
- The Command and Code Template Wizards provide a comfortable GUI assisted way to create scripting language commands or even fragments of code (snippets).
- The Script Execution Support allows to control and debug execution of a script. Providing the ability to execute selected pieces of code, set break points, execute to/from a specific line, execute one command at a time (step by step mode) and follow and highlight the execution progress.
The Java script editor supports two additional script views:
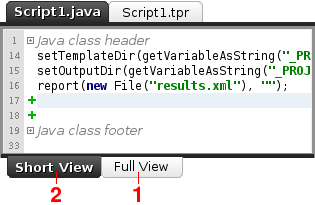
- The Full View displays the whole Java class.
- The Short View displays just the contents of the test() method (or the main try/catch block inside the method) which represents the script body. The rest of the Java class is collapsed into the Java Class Header and Java Class Footer nodes. These can be eventually expanded through a click onto the + box.
The Code Editor supports all usual editing functionality plus a number of specific actions as follows. The short cut keys marked with an asterisk can be configured through the editor Preferences (see the Editor Context Menu chapter).
Action Name | Short Cut Key | Description |
|---|---|---|
Undo | Ctrl+Z | Undo the last edit. |
Redo | Ctrl+Y | Redo the last undone edit. |
Copy | Ctrl+C | Copy the selected text into the system clipboard. |
Cut | Ctrl+X | Cut the selected text into the system clipboard. |
Paste | Ctrl+V | Paste the system clipboard content into the current position. |
Search/Replace | Ctrl+F | Search for or replace a string in the editor. |
Go To Line | Ctrl+G | Go to the specified line number. |
Comment Out | Ctrl+/ (slash)* | Comment out or uncomment the selected code block. |
Toggle Breakpoint | Ctrl+B* | Create/remove a break point. |
Context Menu | Ctrl+Shift+Enter* | Open the editor context menu (same as a mouse right click). |
Command Wizard | Ctrl+Enter* | Open the Command Wizard/Properties. |
Code Template Wizard | Ctrl+I | Open the Code Template Wizard list. |
New Script | Ctrl+N | Create a new script in a new editor. |
Open Script | Ctrl+O | Open a script in a new editor. |
Save Script | Ctrl+S | Save the current script. |
Close Script | Ctrl+W | Close the current script. |
Compile Script | F9 | Compile the current script. |
Run Script | F5 | Execute the current script. |
Pause/Resume | F5 | Pause and resume the currently executing script/schedule. |
Export To Java | Ctrl+J | Convert the script to Java through the Java Converter (TPR scripts only). |
Most of these features are also available in the File and Edit menus of the main GUI.
Editor Context Menu
The context menu is accessible through a right mouse click onto a text line of the text editor component or by pressing Ctrl+Shift+Enter.
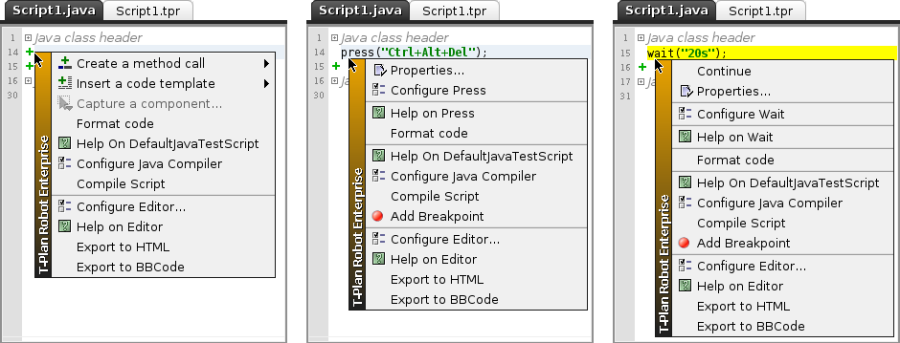
The menu contains three types of actions:
- Stable editor actions such as Compile Script and Configure Editor. These are always available, usually at the bottom of the menu.
- Context actions are associated with the text element on the current line.
- If the line is empty the menu provides access to the Command and Code Template Wizards.
- If the line contains a valid Robot command the menu contains the command actions.
- Some of the commands define additional context or execution specific actions. For example, the Continue action of the Wait command is a dynamic action available only during the command execution and it allows to resume the script immediately.
Desktop Viewer
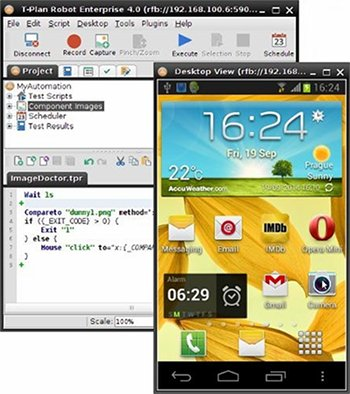
The Desktop Viewer is the GUI component situated at the right side of the T-Plan Robot Enterprise GUI.
When there's no desktop connection it shows the interactive T-Plan Workflow chart which covers the QA and automation life cycle with the T-Plan product line.
When a remote desktop is connected the viewer displays its image and allows to drive it through the local mouse and keyboard.
The desktop viewer may operate in a separate window as 'detached mode'. To set it on or off use the Desktop->Detach Desktop Viewer menu item.
The connected remote desktop serves as the System Under Automation (SUA). The word "remote" means that it is typically another desktop than the local one, hence for the Local Desktop connection this window is not used.
A connection to a desktop can be established in several ways:
- Automatic connection using CLI connect options such as c/connect, -p/password and -u/-user. See the CLI Options Specification.
- Manual connection through the Login Window either at start up or later through the Connect tool bar button or the Desktop->Connect Desktop menu item.
- Programmatic connection through execution of a Connect command or its corresponding Java Script API method from an automated script.
To disconnect from a desktop click the Disconnect tool bar button or the Desktop->Disconnect Desktop menu item. You can also disconnect by execution of a Disconnect command.
As the viewer can handle just one desktop connection at a time (no tabbed views) connecting to another desktop will disconnect the previous connection. Execution of multiple parallel automated processes is typically achieved through the CLI mode (with no GUI displayed).
The viewer automatically switches to read-only mode when a script execution is started to prevent users from unintentionally interfering with the system under automation. This behaviour is configurable in the Desktop Viewer panel of the Preferences window.
The viewer plays an important role in the main GUI. It allows to interact visually with the remote system under automation in order to record and design scripts or to watch progress of an automated process. The Script Recorder and Script Editor are other two major GUI components which cooperate closely with the viewer to produce automation scripts.
The Script Recorder is able to attach to the viewer's input event queue and record user interaction into the active script editor. The Script Editor then allows to execute the script or its part on the connected desktop. Both of these features are covered in more detail the coming chapters.
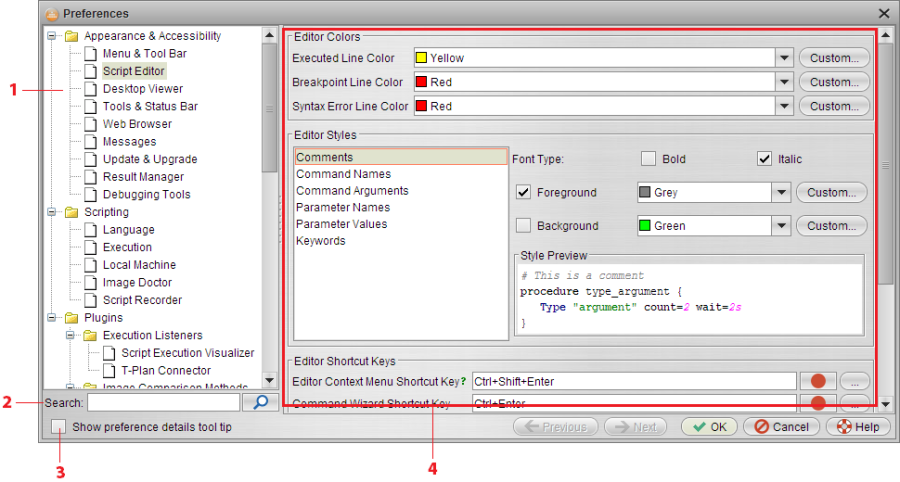
Robot Preferences
Preferences window provides access to T-Plan Robot Enterprise configuration. To open the window select Edit -> Preferences in the main GUI menu. Many T-Plan Robot Enterprise components also provide quick access to their configuration settings in context menus.
 The window consists of the following sections:
- The Preference Tree is situated on the left. It represents a hierarchical structure of preferences organized by topics and T-Plan Robot Enterprise configurable objects.
- The Search field allows to search all dialog panels for the specified keyword.
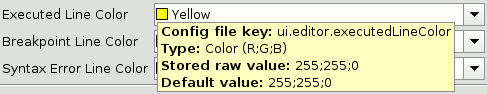
- The "Show preference details tool tip" check box makes the window display internal properties for a preference, such as its key (ID) in the configuration file, the value type with optional list of acceptable values and the current stored value. To get it displayed set on the check box and hover the mouse pointer over the preference.
- The Preference Panel displays preferences (configuration values) for the selected tree node. Each preference is represented by a graphical component, for example by a labeled text field, and generally allows to edit the preference value.